What is the IS curve?
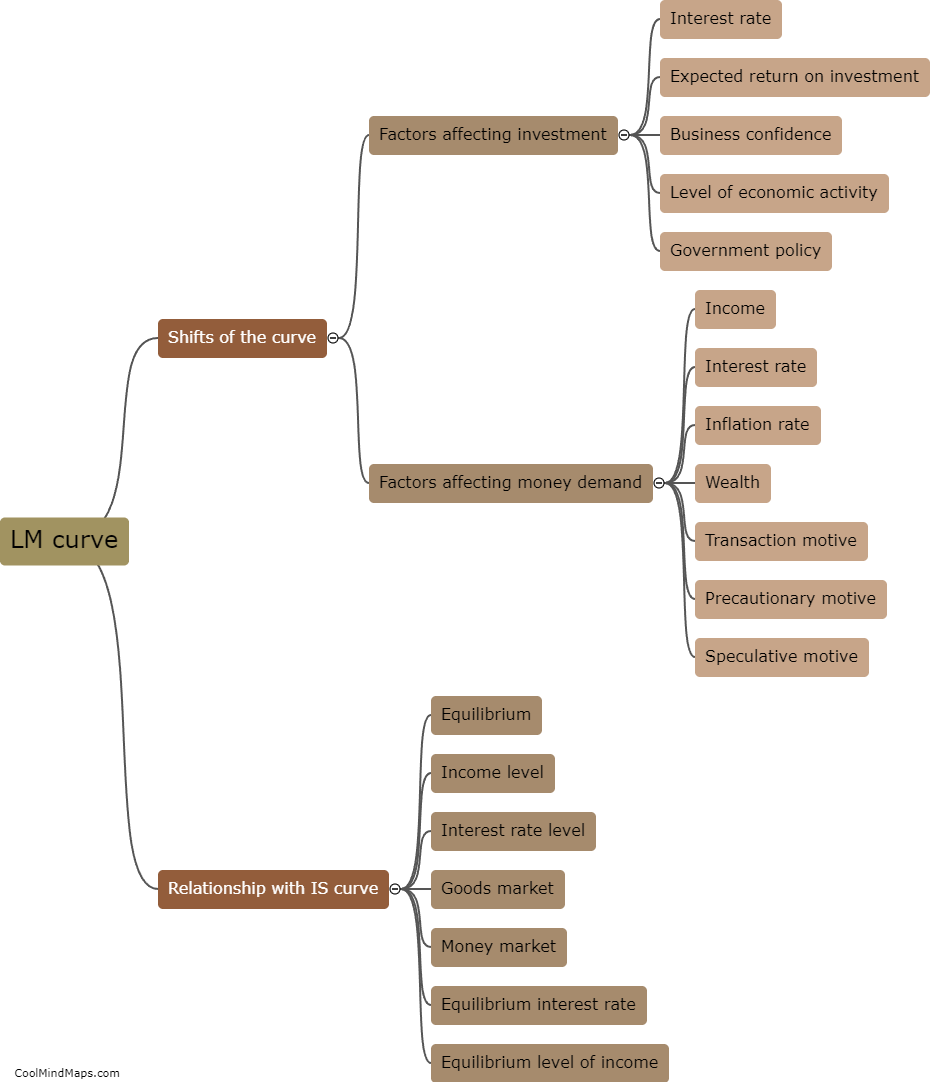
The IS curve, or the Investment-Savings curve, is a graphical representation that depicts the relationship between aggregate income or output and the real interest rate in an economy. It illustrates the equilibrium level of income or output where total spending equals total income. The IS curve is derived from the Keynesian cross model, which emphasizes the interaction between investment and savings in determining aggregate demand. The curve is downward sloping, indicating that as interest rates decrease, investment increases, leading to higher levels of output. Conversely, as interest rates rise, investment declines, resulting in a decrease in output. The IS curve plays a crucial role in macroeconomic analysis and policy-making, as it helps policymakers understand the relationship between interest rates, investment, and the overall health of an economy.

This mind map was published on 18 September 2023 and has been viewed 58 times.
