How to create a plot in R?
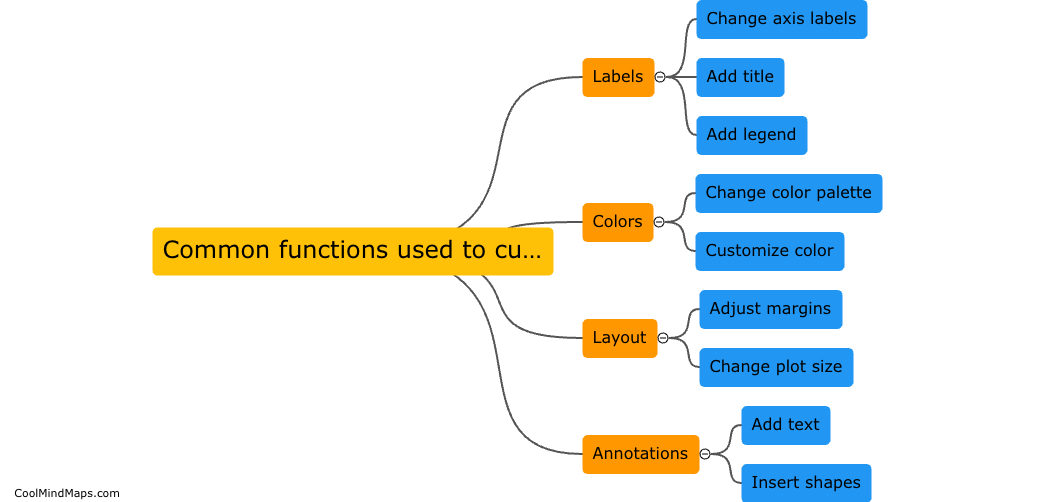
To create a plot in R, you can start by loading your dataset using the read.csv() function or any other data import function. Once your data is loaded, you can use the plot() function to create a basic plot, selecting the variables you want to visualize. You can customize your plot by adding labels, titles, changing colors, and adjusting the appearance of the plot using additional arguments in the plot() function. Additionally, you can create more complex plots using functions like ggplot2, which allows for more customization and flexibility in creating various types of plots. Experiment with different plot types and settings to effectively convey your data and tell a compelling story through visuals in R.

This mind map was published on 15 May 2024 and has been viewed 15 times.